


曲线图学习与作业安排1


You should spend about 20 minutes on this task.
The graph shows the demand for energy and the energy available from fossil fuels in Freedo-nia from 1985 to 2005.
Write a report for a university lecturer describing the information shown below.
You should write at least 150 words.
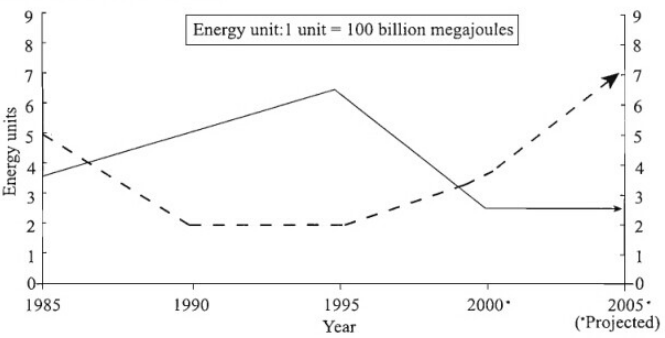
--- energy demand — energy available
首段:使用The line graph indicates the changes of...来改写题目
The line graph indicates the changes of energy demand and the energy available from fossil fuels in Freedonia for 20 years to 2005.【The line graph indicates the changes of...(线状图指出了......的变化。)】
第二段:energy available上升-下降-稳定(必须有具体数据的变化:动态变化)
According to the line graph, the amount of energy available from fossil fuels increased significantly from approximately 3.5 units (each unit is quivalent to 100 billion megajoules) in1985 to 6.5 in 1995, which was its peak. But after that it dropped sharply until 2000 when it remained stable at about 2.5 units until 2005.【According to the line graph, ...(根据......,......);the amount of...(......的数量:用于不可数名词、可数名词就用the number of...);句子...,which+谓语......(......,这......);after that(之后);句子...+时间+when+从句...(......,那时......);remain stable(保持不稳定)--后面如果有数据就用at加数据】
第三段:energy demand下降-微笑变化-上升(必须有具体数据的变化:动态变化)
On the contrary, between 1985 and 1990, the demand for energy decreased gradually from 5units to nearly 2 units. There was little change in this number from 1990 to 1995. Since 1995,it jumped suddenly. In 2000, this number increased to less than 4 units but after then it will go up more rapidly and reached 7 units in 2005.【On the contrary, ...(与之相反,......); There was little change in...(......有着微小的改变。)】
结尾段:用energy available和energy demand进行相比于对比:前句是相比后句是对比(静态比较)
It can be seen from the line graph that energy available was higher than energy demand from 1986 to 1999. However, after 1999, energy available was unable to keep up with energy demand .【It can be seen from the line graph that+从句...(从线状图能够得出......);...be higher than...(......比......更高);However,+句子...(然而,......。);be unable to keep up with...(不能满足......)】
译文:
线状图指出了到2005年为止的20年间Freedonia地区化石燃料的能量需求和能量供应上的变化。
根据线状图,化石燃料的供应数量从1985年的3.5个单位(每个单位等价于一亿焦耳)开始显著增长,并在1995年达到了最多的6.5个单位。但随后该数字快速的下降,在2000年稳定在2.5个单位并一直延续到2005年。
与之相反,在1985年到1990年间,随能源的需求从5个单位逐步地减少到2个单位附近。从1990年到1995年这个数字有着微小的改变。自从1995年,该数字却陡然增加。到了2000年,增加到稍少于4个单位的水平,但之后又快速地增长,在2005年达到了7个单位。
从线状图能够得出在1986年至1999年间能源的供应量大于能源的需求量。然而,在1999年之后,供应量并不能满足对能源的所需。
作业:写完提交批改
You should spend about 20 minutes on this task.
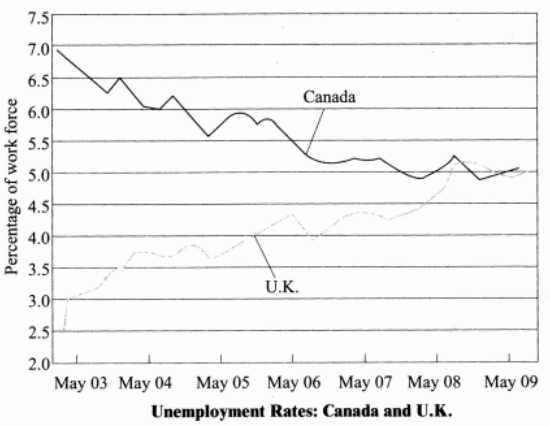
The chart below shows the unemployment rates in the U.K. and Canada between May2003 and May 2009.
Write a report for a university lecturer describing the information shown below.
You should write at least 150 words.