


曲线图学习与作业安排2
You should spend about 20 minutes on this task.
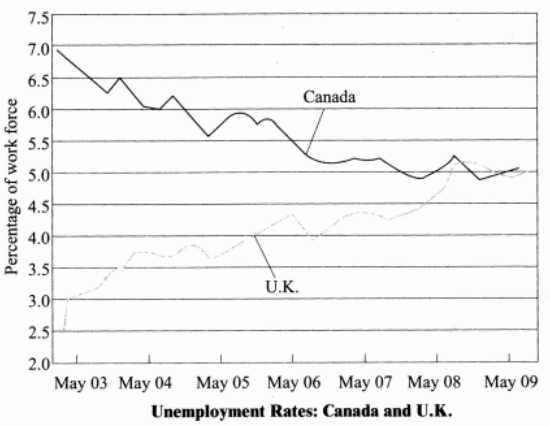
The chart below shows the unemployment rates in the U.K. and Canada between May2003 and May 2009.
Write a report for a university lecturer describing the information shown below.
You should write at least 150 words.
首段:使用The graph compares...来改写题目,紧随其后进行对比。
The line graph compares the unemployment rates in Canada and in the U.K over a span of 6 years from May 2003 to May 2009 when the unemployment rate in Canada revealed a trend of gradual decline, whereas that in the U. K. witnessed an opposite tendency, namely, a steady rise.【The line graph compares...(曲线图对比的是......的情况。);句子...+时间+when+从句...(......,那时......); reveal a trend of gradual decline(呈现出逐渐下降的趋势);...,whereas+句子...(......,然而,......);that in UK中的that代替前面the unemployment rate in Canada中的the unemployment rate;...,namely,...(......,即......);a steady rise中的rise是名词】
第二段:英国的失业率上升-波动-上升-下降(必须有具体数据的变化:动态变化)
Obviously, there was a dramatic increase in the unemployment rate in the U. K. between2003 and 2004, rising from about 2.5% to 3.85%. Nevertheless, the following year experienced a slight fluctuation. From May 2005 to the middle of 2008, there was a stable growth accompanied by occasional fluctuations. Particularly in 2008, it peaked at approximately5.4% and afterwards began to show minor drop before finally ending up at 5%.【Obviously,...(很明显,.....。);there was a dramatic increase in...,rising from...to...(......从......快速上升到......。);Nevertheless,...(然而,......); the following...(接下来的......);experience a slight fluctuation(经历了轻微的波动);there was a stable growth accompanied by+名词...(伴随着......,......出现稳定的增加趋势。);particularly,...(尤其是,......);peak at...(达到了......的最高值);afterwards之后=after that;show minor drop(微弱的下跌);began to show minor drop before finally ending up at...(开始转入微弱的下跌,最终以......收尾)】
作业:
You should spend about 20 minutes on this task.
The line graph below shows changes in the amount and types of fast food consumed by American teenagers from 1980 to 2005.
Describe the information shown in the graph.
