


雅思图表写作学习【1】


曲线图line graph=curve graph【动态图:有变化】
首段:改写
The line graph illustrates statistical data concerning...【曲线图描述了关于......的数据。】
范文:
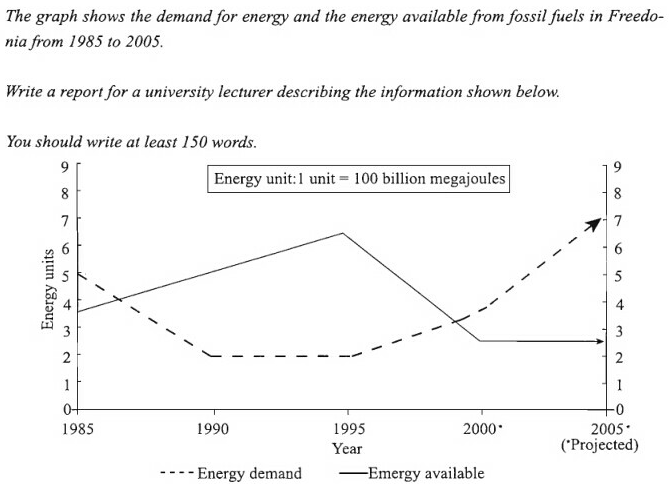
The line graph illustrates statistical data concerning the energy demand and the energy available that were from fossil fuels in Freedonia over a span of 15 years between 1985 and 2005.【31】
中间段:【分段:2段】
第二段:energy demand的趋势变化
Although+从句...,主句...【尽管......,但是......】
范文:
Although the number of the energy demand from the fossil fuels suffered from a downward trend from approximately 5 units in 1985 to 2 units in 1990 and then remained almost stable between 1990 and 1995, it witnessed a surprising increase to the peak at 7 units in 2005.【45】
第三段:energy available的趋势变化
主句...,while+从句...【......,然而,......】
范文:
Moreover,the energy available whose figure was about 3.7 units in 1985 from fossil fuels soared abruptly to 6.2 units in 1995,while it collapsed significantly to 2.3 units in 2000 and then stayed steady from 2000 to 2005.【39】
结尾段:总结概括--写出最明显或最突出的地方【作比较或对比】
There is/are/was a great change【有巨大的变化】
范文:
To sum up,there was a great change over the energy demand and the energy available from the fossil fuels,and the number of the energy available was much more than that of the energy demand in Freedonia from 1985 to 2005.【42】
附加:
...+时间+when+主语+谓语...【......,那时,......。】
The energy demand from the fossil fuels indicated a dramatic decrease to nearly 2.3 units in 2000 when it remained stable in 2005.
...+地点+where +主语+谓语...【......,在那,.......。】
The energy demand from the fossil fuels indicated a dramatic decrease to nearly 2.3 units in 2000 in Freedonia where it remained stable from 2000 to 2005.
格式:
The line graph illustrates statistical data concerning the energy demand and the energy available that were from fossil fuels in Freedonia over a span of 15 years between 1985 and 2005.
Although the number of the energy demand from the fossil fuels suffered from a downward trend from approximately 5 units in 1985 to 2 units in 1990 and then remained almost stable between 1990 and 1995, it witnessed a surprising increase to the peak at 7 units in 2005.
Moreover,the energy available whose figure was about 3.7 units in 1985 from fossil fuels soared abruptly to 6.2 units in 1995,while it collapsed significantly to 2.3 units in 2000 and then stayed steady from 2000 to 2005.
To sum up,there was a great change over the energy demand and the energy available from the fossil fuels,and the number of the energy available was much more than that of the energy demand in Freedonia from 1985 to 2005.