


雅思图表写作之饼状图学习


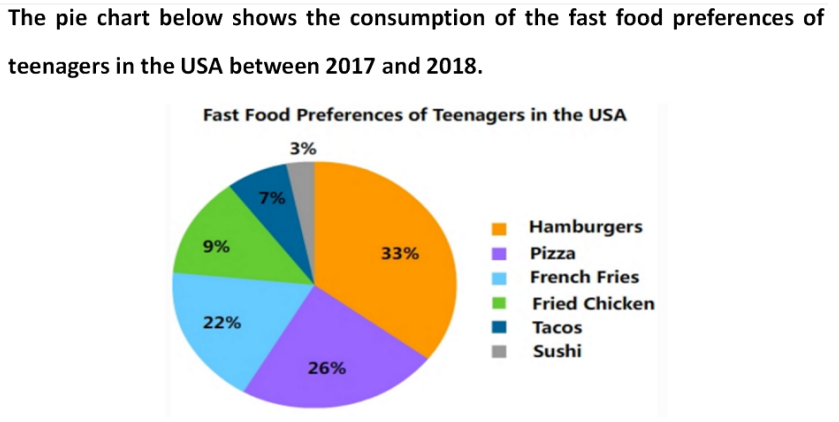
The pie chart illustrates statistical data concerning the consumption of the fast food preferences including hamburgers,pizza,french fries,fried chicken,tacos and sushi for teenagers in the USA from 2017 to 2018.
As can be seen from the pie chart,hamburgers whose consumption occupied 33% ranked the first place,followed by the pizza with 26% . Moreover,the percentage of the pizza was 4% more than that of french fries accounting for 22%. Besides,the fried chicken and tacos that were almost similar had 16%,seizing 9% and 7% respectively. Obviously,the least popular fast food preferences of teenagers was sushi which dominated merely 3%.
According to the pie chart,we can see that the consumption of hamburgers,pizza and french fries leaving 81% was nearly 4 times as much as that of fried chicken,tacos and sushi having only 19%.
To sum up,there was a big difference on the fast food preferences of teenagers in the USA over a span of one year between 2017 and 2018.